Now that 2019-20 Post-School Outcome (PSO) data are published, CCTS is taking a closer look at state-level data by exit categories (Graduated and Dropped out). Based on years of data, we know that outcomes are higher for students who graduate than those who drop out.
To determine how we might better support students before they drop out of school, CCTS is examining PSO data by exit categories for different demographics. One of the demographic categories for PSO data is English proficiency. While in school, students are categorized with Limited English Proficiency (LEP) or Not Limited English Proficiency (NLEP). Of the 2019-20 special education leavers in Washington state who responded to the Post-School Survey, approximately 13.6% are categorized with LEP, 86.1% with NLEP, and 0.3% have an unknown category.
When we reviewed the data for students with LEP and NLEP by exit categories, we started by looking at engagement rates. Any Engagement means that students met reporting requirements for one of the four engagement outcomes (Higher Education, Competitive Employment, Other Education, or Other Employment).
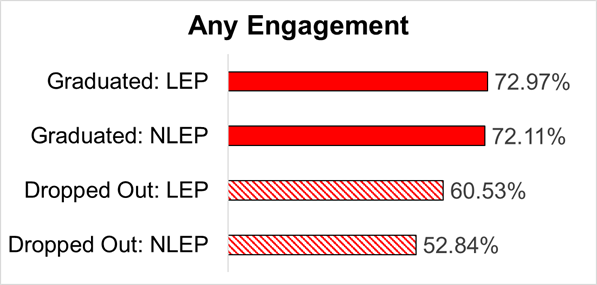
Among respondents who graduated high school, rates of Any Engagement for respondents with LEP and NLEP were similar (approximately 73% and 72%, respectively). For respondents who dropped out, there was a notable difference. Engagement rates are higher for respondents who dropped out and have LEP than those who dropped out and have NLEP (approximately 61% and 53%, respectively).
Figure 1: Percentage of respondents by Exit and English Proficiency categories who met reporting criteria for one of the four engagement outcomes
To get a better understanding of their post-school activities, we took a closer look at engagement outcomes. We noted that for both respondents who graduated and those who dropped out, Competitive Employment is higher for those with LEP than NLEP.
- Competitive Employment for respondents who graduated and have LEP is approximately 32%, compared to 27% for those who graduated and have NLEP.
- Competitive Employment for respondents who dropped out and have LEP is approximately 28%, compared to 23% for those who dropped out and have NLEP.
| Demographic Categories | Respondents | Higher Education | Competitive Employment | Other Education | Other Employment | No Engagement |
|---|---|---|---|---|---|---|
| Graduated: LEP | 862 | 14.85% | 32.02% | 4.52% | 21.58% | 27.03% |
| Graduated: NLEP | 5,435 | 19.45% | 26.95% | 4.47% | 21.23% | 27.89% |
| Dropped out: LEP | 114 | 1.75% | 28.07% | 6.14% | 24.56% | 39.47% |
| Dropped out: NLEP | 740 | 1.62% | 23.24% | 5.81% | 22.16% | 47.16% |
Source: Center for Change in Transition Services, unpublished data, 2021
In our initial review of outcomes by exit and English proficiency categories, we have further questions to consider at the state, ESD and the district level. These include:
- Are the observations we’ve noted in state-level data the same or different when we examine outcomes by ESD?
- Do the individual survey responses provide information to the district to identify specific programs or services that may influence positive post-school outcomes for students who dropped out?
- Are there differences in engagement outcomes for respondents who dropped out when disaggregated by disability, gender, and race/ethnicity categories?
CCTS encourages schools to review their PSO data and reach out to our team for support if you have questions. We’ll continue to share our observations and questions about state-level data in future newsletters. Click to Subscribe.
